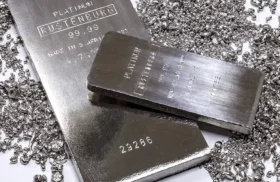
Picture a silvery metal so dense it feels like it shouldn’t belong on Earth at all. That’s platinum, atomic number 78: 21.45 g cm⁻³ of heft that won’t melt until 1 768 °C. It shrugs off rust, zips heat and electricity along with ease, and speeds up chemical reactions like nothing else. Because miners rarely coax more than seven million ounces a year from the ground, scarcity is baked into its DNA—one reason catalytic converters, PEM fuel cells, green-hydrogen electrolysers and bullion investors won’t let go of it.
History of Discovery and Use
Ecuadorian goldsmiths were fusing platinum dust into trinkets around 700 BCE, but Europe stayed oblivious until 1735, when Antonio de Ulloa shipped tales of “platina” home from Colombia. Chemists cursed its “unmeltable” nature for decades—until 1783, when François Chabaneau finally bent it to his will.
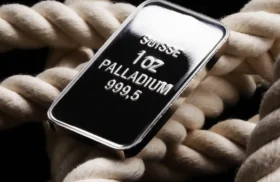
Russia even coined platinum roubles in the 1800s, yet the metal’s big break came with Wilhelm Ostwald’s nitric-acid catalyst in 1902 and Cartier’s Art-Deco boom a few years later. Car-exhaust rules in 1975 sparked mass demand; palladium swaps shook things up in the 2010s; now the hydrogen boom—and a raft of ETFs—writes the next chapter.
Shutterstock
Global Platinum Production and Supply Dynamics
Mine supply looks set to slip to roughly 7 Moz in 2025, a five-year low. South Africa still delivers nearly three-quarters of that haul, but Eskom blackouts and aging shafts keep tripping it up. Russia (about 10%) stays steady despite sanctions snarls, while Zimbabwe inches ahead. Scrap from spent auto-cats hasn’t bounced back, so the World Platinum Investment Council warns of a third straight deficit—around 0.97 Moz—leaving above-ground stocks at barely four months’ cover. No wonder prices twitch at every faint tremor on the Bushveld grid.
Leading Producer Companies
Major Producers
- Valterra Platinum (South Africa) – Mogalakwena and satellite pits produced 1.65 Moz platinum within 3.9 Moz 6E PGMs in 2024; Mogalakwena North expansion FID deferred to Q4-25.
- Impala Platinum (South Africa/Zimbabwe/Canada) – Rustenburg, Marula, Zimplats and Lac-des-Iles yielded 0.68 Moz Pt (1.48 Moz PGMs) FY-24; rebuilt Furnace 5 should lift recoveries from late-25.
- Sibanye-Stillwater (South Africa/USA) – SA reef shafts plus Stillwater complex delivered 0.62 Moz Pt in 2024; loss-making Stillwater West idled pending revised plan targeting 100 koz rebound by 2027.
- MMC Norilsk Nickel (Russia) – Norilsk-Talnakh ores produced 585 koz Pt in 2024; 2025 guidance 570–610 koz while smelter-furnace overhauls proceed.
- Northam Platinum (South Africa) – Zondereinde, Booysendal and Eland mines turned out 0.46 Moz Pt FY-24; Eland restart adds ~70 koz from 2026.
- Zimplats (Zimbabwe) – Ngezi underground and Selous refinery delivered 298 koz Pt FY-24; third concentrator and expanded smelter lift capacity toward 380 koz by 2027.
- KGHM Polska Miedź (Poland) – Lubin–Rudna polymetallic ores extracted 9.7 koz TPM in January 2025 (116 koz Pt-eq annualized); Głogów tailings pilot recycles PGM-rich residues.
Mid-sized Players on the Move
- Ivanhoe Mines (South Africa) – Platreef first concentrate expected Q4-25; Phase 1 targets 410 koz Pd pa sweetened by Ni and Cu credits.
- Generation Mining (Canada) – Marathon received final construction permit May 2025; 3.6 Moz PdEq over 13-year life targeting 245 koz pa once financing secured.
- Wesizwe Platinum (South Africa) – Bakubung advances toward 260 koz steady-state production with shaft infrastructure complete.
- Sedibelo Platinum Mines (South Africa) – Pilanesberg Phase 2 expansion targets 150 koz Pt additional capacity via optimized mining layouts.
- Waterberg JV Partners (South Africa) – Large-scale mechanized project aims for 420 koz 4E production from 2028.
- Tharisa (Zimbabwe) – Karo PGM Phase 1 targets 150 koz PGM 6E (80 koz Pd); commissioning delayed to June 2025, solar-hybrid power secured.
- Eastern Platinum (South Africa) – Crocodile River tailings retreatment delivered 15 koz Pt in 2024; circuit optimization aims to double ounces by 2026.
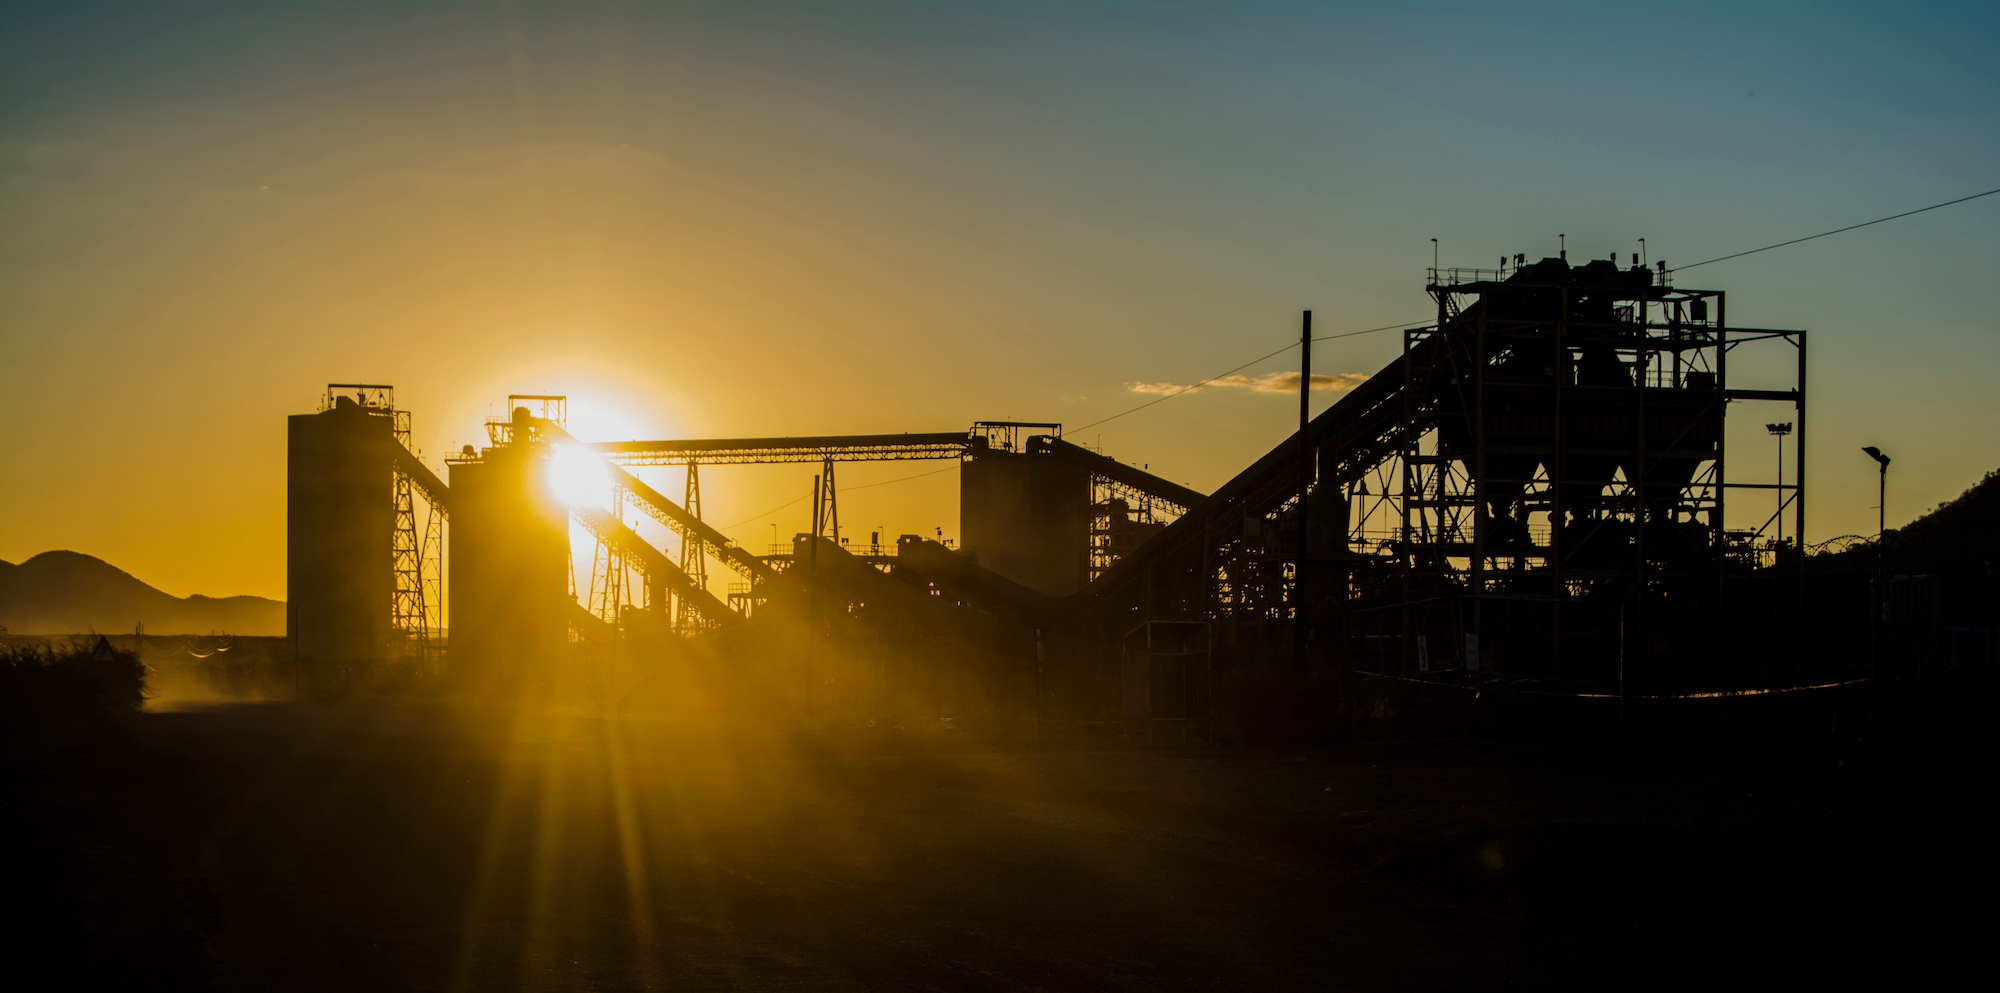
Platinum Mine in North West, South Africa, Shutterstock
Industrial Applications Driving Platinum Demand
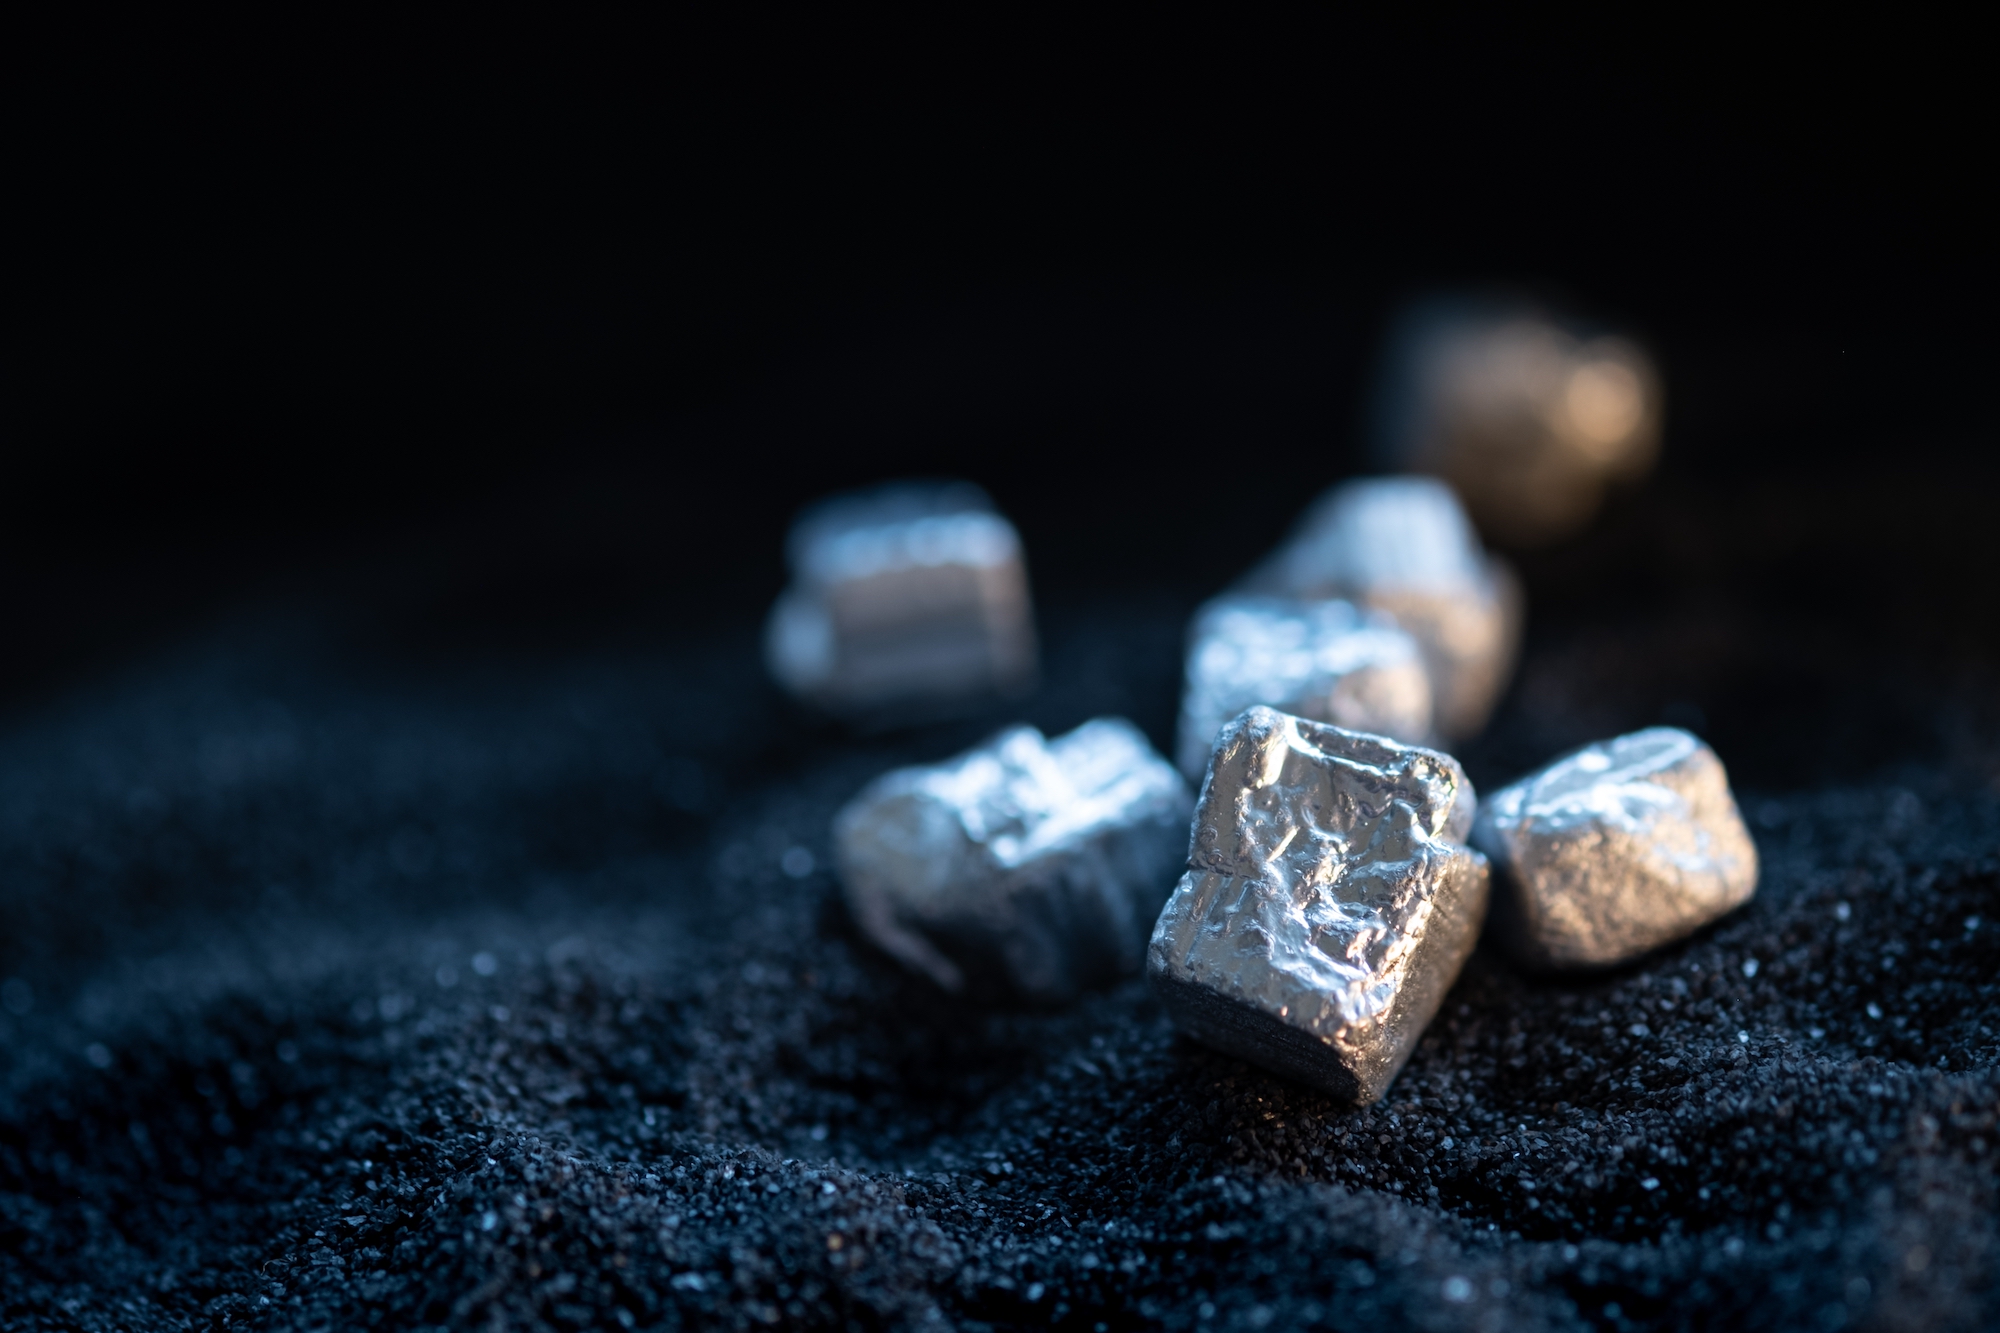
Global platinum absorption is on course to edge past ≈ 8.1 Moz (252 t) in 2025, a shade higher than 2024 as mine output in South Africa and Russia remains constrained. End-use remains a five-horse race—autocatalysts, jewellery, industrial catalysts, glass/fibreglass, and a fast-growing hydrogen segment—while investment flows add the swing tonnage that turns balance sheets from surplus to deficit. Scrap recovery is projected to furnish ≈ 1.9 Moz, or 23% of requirements, leaving the primary market finely balanced even before hydrogen’s pull tightens the screws.

Shutterstock
Autocatalysts are still the vacuum-cleaner of the platinum universe, expected to chew through ≈ 2.8 Moz in 2025 (about 35%). Euro 7 and China VII regulations raise PGM loadings on both light-duty gasoline and heavy-duty diesel vehicles, and with palladium and platinum now trading near parity, OEM calibrations are switching out up to 25% of Pd for Pt without hardware redesign—worth roughly USD 700 in metal savings per car. The heavier dosing only partly offsets falling internal-combustion sales: consultancy models suggest auto Pt demand grows a modest 2–3% CAGR through 2027, but the substitution effect protects the floor under 2.7 Moz even in aggressive EV-penetration cases.
Hydrogen technology provides the steepest growth slope. Proton-exchange-membrane (PEM) electrolysers and fuel-cell electric vehicles together consumed ≈ 0.27 Moz in 2024; if current project backlogs convert on schedule, annual offtake could hit ≈ 0.5 Moz by 2028—more metal than the entire glass sector today. Each 1 GW PEM electrolyser installs 6–8 koz Pt in porous electrodes, while a fuel-cell passenger car carries 30–40 g in its stack. Incentives under the U.S. Inflation Reduction Act and EU REPower target have pulled 40+ GW of PEM capacity into late-stage engineering, shifting the debate from “if” to “how fast.” Early recycling pilots claim >95% Pt recovery from spent stacks, but large-scale flows are unlikely before 2030.
Industrial and consumer niches add essential depth. Chemical and petroleum catalysts—including nitric-acid gauzes, refinery reforming beds and silicone-curing systems—hold a steady ≈ 14% share (about 1.1 Moz). Glass and fibreglass crucibles account for ≈ 7% (~0.6 Moz), with flat-panel cooldowns offset by solar-glass expansions in India and the Middle East. Medical devices, hard disks and other electronic applications absorb ≈ 5% (~0.4 Moz), propped up by a 40% rise in heat-assisted magnetic-recording (HAMR) drives. Jewellery is staging a comeback—especially in India, and to a lesser degree China—aiming for about 2.1 Moz in 2025 (≈ 26%) as price-conscious millennials pivot to 950 Pt bridal sets. Investment demand—bars, coins and physically backed ETFs—remains the elastic tier, typically swinging between 0.2 Moz inflows in risk-off phases and similar-sized outflows when gold catches a stronger bid. With secondary supply barely growing and hydrogen setting up a fresh structural bid, the platinum market’s margin for error is shrinking fast.
Platinum Market & Price Trends
Spot platinum kissed USD 1 420 / oz on 17 July 2025, 51% up on New Year’s Day. Analysts still peg a cautious USD 1 100 average for the year, but the maths looks tight: WPIC sees a 966 koz deficit as substitution, PEM builds and shrinking stocks out-run mine output. A stronger dollar or a BEV surge could cool the rally—otherwise, buyers may have to chase metal that simply isn’t there.
Investment Opportunities
Each gigawatt of PEM electrolyser capacity locks away 6–8 koz of platinum—call it USD 8 million at today’s price. Europe has already banked a third of its 2030 target, and other regions are scrambling. Physical tightness shows in London’s 5% premiums. Low-cost producers like Valterra or Impala offer leverage, but mind the potholes: faster BEV adoption, thriftier catalysts, or a recycling boom could steal the punch bowl.Future Outlook
Most forecasters put 2030 demand near 10 Moz, with hydrogen eating a full quarter. New supply? Only six projects over 250 koz a year are pencilled in, and funding lags plague two of them. Grades on the Bushveld are falling 2–3% a year, ESG screens are tightening, and scrap still lags. Barring a big discovery or a recycling leap, platinum looks set to trade on a higher floor.
Frequently Asked Questions (FAQ)
Why is platinum critical for green-hydrogen production?
PEM electrolysers and fuel-cell membranes rely on platinum’s unmatched ability to catalyse hydrogen reactions under acidic, low-temperature conditions.
Which countries mine the most platinum?
South Africa (~73% of 2024 output) dominates, followed by Russia (~10%), Zimbabwe (~8%), Canada (~4%) and the United States (~3%).
Who are the top platinum-producing companies in 2025?
Valterra, Impala, Sibanye-Stillwater, Norilsk Nickel and Northam refine more than half of global mined platinum.
How much platinum does a typical hybrid car use?
Euro 7-ready hybrid catalysts contain roughly 3–5 g of platinum—about 20% more than 2020 designs.
What is the platinum supply deficit and why does it matter?
A 0.97 Moz shortfall expected for 2025 means demand exceeds mine plus scrap supply by around 12%, tightening inventories and heightening price sensitivity.
Are platinum ETFs a good investment vehicle?
They provide low-friction exposure but warrant close watch on fees and tracking error.
Does recycled platinum differ from mined metal?
Chemically identical, yet volumes hinge on scrappage rates and collection networks, making secondary supply more price-elastic and less predictable.
What could hold platinum prices back over the next five years?
Rapid BEV penetration, aggressive catalyst thrifting, a surge in recycling or a persistently strong U.S. dollar.

")