Slip a cubic metre of gold onto the scales and the dial jumps to 19.32 tonnes—yet the metal is soft enough to take a tooth-mark, a party trick jewellers still trot out when nobody’s looking. It melts at 1 064 °C, refuses to boil before about 2 836 °C, and, thanks to one lonely 6s electron squeezed by relativistic physics, shuttles electricity at roughly 48.8 MS m-¹ while whisking away heat at around 315 W m-¹ K-¹.
Because its crystal lattice almost “self-mends” during cold-working, a single ounce can become nine square metres of foil only one-tenth of a micron thick or stretch into a hair-fine wire 50 km long. The mellow yellow colour? That’s the relativistic contraction again, trimming the energy gap so blue light disappears and red-green tones bounce back. More than 95 percent of all the gold ever coaxed from rock still sits above ground, shrugging off humidity and sulphur that would tarnish silver in a weekend.
Laboratories love gold’s resilience: thin films shrug off neutron bombardment, so CERN coats vulnerable components in the Large Hadron Collider. Only under high-pressure alkaline fusion do oxides such as Au₂O and Au₂O₃ bother to show up. Surgeons and dentists, meanwhile, prize its hypo-allergenic calm; pacemaker leads and inlays can spend decades in the body without causing so much as an itch.
From a circular-economy angle, gold is a dream material. Roughly 214 000 t—around US $680 billion at today’s price—reside in jewellery, bullion, coins and electronic scrap. End-of-life jewellery comes back at close to a 95 percent rate, and properly collected circuit boards hit the high 80s. Urban-mining plants in Belgium, Japan and Singapore cheerfully dissolve discarded phones and retrieve up to 400 g of gold per tonne—an ore grade most conventional pits can only envy.
History of Discovery and Use
The love affair began in antiquity. Egyptian and Mesopotamian artisans threaded native nuggets into beads around 4000 BC. Fast-forward two and a half millennia and Lydia was minting electrum coins, setting a template for Rome’s aureus, Florence’s florin and, much later, Britain’s 1816 Gold Standard. Jump to 1944: Bretton Woods chained the dollar to gold at US $35 an ounce. President Nixon cut that tether in 1971, and prices have floated—or sometimes lurched—ever since.
Technology followed its own winding path. Arab dentists wired teeth with gold by 700 AD. In the 1960s Motorola engineers discovered that hair-thin gold wire bonded silicon chips better than anything else, a revelation that still swallows roughly 50 t of the metal each year. Since the mid-1970s, satellites have worn whisper-thin gold films to deflect infrared heat, and the James Webb Space Telescope flashes a mere 48 g of vapour-deposited gold across its giant mirrors.

Shutterstock
Global Gold Production and Supply Dynamics
World supply in 2024 reached an all-time high of 4 974 t, nudging one percent higher than the year before. Mines provided 3 661 t; recycling, buoyed by strong prices, surged 11 percent to 1 370 t.
China remained king of the producers at roughly 380 t—about a tenth of global output—trailing down through Russia, Australia, Canada, the United States and Ghana. Yet the deepest lodes on paper lie elsewhere: Australia shows about 12 000 t of reserves, Russia 11 000 t and South Africa still a respectable 5 000 t.
Head grades in open pits slipped under 1.3 g t-¹ in 2024, half the level seen at the turn of the century, meaning twice as much rock must be shifted for every ounce. S&P Global now cautions that primary mine supply could crest before 2028 unless new discoveries pick up steam.
Artisanal and small-scale miners add an opaque 550–600 t a year and, regrettably, more than 1 800 t of mercury emissions. The Minamata Convention tightened trade rules in 2024, and Ghana’s new Community Mining Scheme swaps licences for mercury-free, mechanised processing—a small but hopeful step.
Central banks keep the physical market tight. They soaked up 1 045 t in 2024, a third record year. Poland tucked away another 90 t; the People’s Bank of China bought month after month. If official-sector demand stays north of a thousand tonnes and mine growth remains sluggish, the World Gold Council foresees a 70 t shortfall in 2025.
Leading Producer Companies
Major producers
- Newmont – 6.8 Moz in 2024 after absorbing Newcrest; anchors include Nevada Gold Mines, Pueblo Viejo and Cadia.
- Barrick Gold – 3.91 Moz, targeting a 30 percent lift by 2030 through Carlin and Loulo-Gounkoto.
- Agnico Eagle – 3.49 Moz; Detour Lake is now Canada’s biggest single gold mine.
- Polyus – about 3 Moz despite sanctions pinching equipment imports.
- AngloGold Ashanti – 2.66 Moz, now chiefly NYSE-listed.
- Gold Fields – 2.07 Moz; Salares Norte should add roughly 450 koz a year from 2025.
- Kinross – 2.17 Moz, guiding near 2 Moz annually through 2027.
- Zijin Mining – about 73 t (2.35 Moz), ranking in the global top six.
Growth-minded mid-caps
Endeavour Mining expects to top 1.5 Moz by 2026 at Lafigué. Evolution Mining sees about 950 koz in 2025 once Cowal Underground hits stride. Lundin Gold keeps Fruta del Norte humming above 500 koz, while B2Gold’s Goose, Calibre’s Valentine Lake and K92’s Kainantu Stage 3 together could bring more than 2 Moz of fresh supply before 2030.

Shutterstock
Industrial Applications Driving Demand
Jewellery still takes the biggest slice—about 1 877 t or 46 percent of demand—but it is famously fickle. Indian shoppers, for example, bought 12 percent less after rupee prices set new records. Investors hungry for bars and coins claimed roughly 1 179 t, equal to nearly a quarter of the total, with Germany, Türkiye and China leading the charge. Central banks bought another 1 045 t, almost a fifth of global demand and stubbornly price-insensitive. Technology soaked up 326 t, most of it in electronics as AI servers and 5 G kit rolled off production lines. Looking ahead, renewable-diesel catalysts using chloride chemistry and nanogold drug carriers in oncology labs hint at fresh uses that, while small today, could prove sticky tomorrow.
Gold Market Analysis & Price Trends
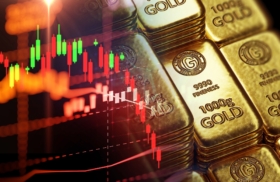
On 15 July 2025 the metal changed hands at US $3 352 an ounce, still glittering close to April’s record peak of US $3 500.50. Forecasts, it must be said, are all over the map. HSBC pegs the year’s average near US $3 215. The LBMA’s expert panel calls for something closer to US $2 736. J.P. Morgan aims at around US $3 675 in the fourth quarter, whereas Goldman Sachs just nudged its year-end mark to US $3 300 and flashes a bull-case of US $3 700.
Several levers push and pull that price. Real yields remain underwater across much of the G20, a boon for non-interest-bearing assets. Central banks diversifying away from the dollar remove sizeable, patient volumes from the market. Geopolitical flare-ups and tariff rows keep nerves on edge. And then there is the algo swarm: roughly 38 percent of COMEX quote traffic now originates from machines, which can whip prices ten percent in a single trading session before most human traders have finished their coffee.
Investment Opportunities & Risks
For exposure, take your pick: allocated bullion locked in a vault, nimble ETFs such as GLD or IAU, actively managed mining-equity funds, royalty and streaming firms that clip production coupons, or even blockchain tokens that represent audited bars. Over the past 23 years gold’s correlation with the S&P 500 has averaged –0.27, meaning a modest 3-to-10 percent slice historically cushioned portfolio drawdowns.
Still, nothing is bullet-proof. A stronger dollar can clip the metal’s wings. India’s 15 percent import duty weighs on the world’s second-largest jewellery market. ESG investigators are poking harder at artisanal supply chains. Smart-contract bugs lurk in some tokenised products. On the mining side, lower grades, water shortages, sanctions on equipment, steeper diesel bills and tougher tailings rules all threaten margins, while wild currency swings can blow holes in budgets where costs are local but revenue is in greenbacks.

Shutterstock
Frequently Asked Questions (FAQ)
Why does gold hold value when paper currencies wobble?
Because its above-ground stock grows only one to two percent per year, making supply far less elastic than credit creation. Couple that scarcity with chemical permanence and global recognition, and the metal tends to keep purchasing power when trust in fiat money slips.
Where is gold mined and refined now?
About half of primary output comes from China, Russia, Australia, Canada, the United States and Ghana. The heavyweight refiners—capable of 400-plus tonnes a year—operate in Switzerland’s Ticino, China’s Shenzhen, Dubai in the UAE and Mumbai in India.
Which companies truly move the needle?
Eight majors—Newmont, Barrick, Agnico Eagle, Polyus, AngloGold Ashanti, Gold Fields, Kinross and Zijin—account for roughly a third of mined supply. Their multi-country portfolios and all-in sustaining costs often under US $1 100 an ounce give them outsized influence over exploration budgets and project pipelines.
Do central-bank purchases matter?
Absolutely. Official-sector buying pulled more than a thousand tonnes off the market in 2024, tightening supply and signalling that some monetary authorities view the dollar with a touch more scepticism. Investors tend to notice.
Is recycled gold as good as freshly mined metal?
Yes. Once refined to London Good-Delivery standards of 99.5 percent purity or better, recycled and mined bars are chemically identical. The LBMA makes no distinction, and neither do fabricators or central banks.
How much gold hides inside a smartphone?
Roughly 25–35 mg—worth about US $3-4 at current prices. Tiny per handset, but aggregated e-waste grades run roughly 200 times richer than many surface mines.
What headaches keep mine managers awake in 2025?
Falling grades inflate costs, water scarcity threatens arid-zone operations, ESG and community issues can stall permits, sanctions make gear harder to source in some jurisdictions, and diesel prices bite open-pit margins. Exchange-rate whiplash can also widen the gap between local spending and dollar income.
How can I own gold without lugging bars?
Bullion-backed ETFs such as GLD or IAU offer daily liquidity. Royalty and streaming firms provide diversified cash flows linked to mine output. Fully regulated blockchain tokens grant fractional ownership of vaulted metal, handy for investors who like their assets digital but tangible all the same.